LAMP is a code for multiple testing correction. Given the relationships between transcription factors (TFs) and genes and gene expression levels, the code lists up statistically significant combinations of TFs. The LAMP algorithm calibrates the Family-Wise Error Rate (FWER) at the same level of Bonferroni correction. Applying our method to your data instead of using the Bonferroni correction gives you the below advantages:
- Listing up significant combinations without an arity limit
- Higher sensitivity than Bonferroni correction
- Fast calculation speed
This manuscript is written for finding TF combinations. The LAMP is, however, capable of discovering other combinatorial effects, including, but not limited to, the following examples:
- Combinations of miRNA interactions that regulate gene expression
- Combinations of histone acetylations and methylations that influence gene transcription
- Combinations of single-nucleotide polymorphisms (SNPs) associates with the phenotype
- LAMP 2.0.3 (Jun. 28, 2015):
-
- Fixed bugs in drawing flower diagram
- Change default lcm file path to absolute path
- Older releases.
Table of Contents
Installation
Download
If you have Git, you can download the latest version by running:
$ git clone https://github.com/a-terada/lampIf you do not have Git, after downloading LAMP in either zip or tar formats, you need to extract the archive with unzip or tar command.
Install
The programs are written in python (>=2.6) except frequent pattern mining. You set up the LAMP by the following command in lamp/ directory.
$ makeIn lamp directory, you can use LAMP by using the following command:
$ python lamp.py -p [p-value-procedure] [item-file] [value-file] [significance-level] > [output-file]When the development version of LAMP is used, you can perform fastWY by using the following command:
$ python fastwy.py -p [p-value-procedure] [item-file] [value-file] [significance-level] [k] > [output-file]The details of the arguments, options and input and output formats are described in Usage.
Examples
Here, we present three examples of running LAMP. First two examples are toy examples, and the last one generates the exactly identical result shown in our paper.
Demonstration 1: Mann-Whitney U-test
We here use two small files in sample/ directory.
-
- sample_item.csv
- An example file of item-file. This file contains the associations between 15 genes and four motifs.
-
- sample_expression_value.csv
- A sample file of value-file to use Mann-Whitney U-test. The gene orders should be exactly identical to item-file (
sample_item.csv).
The following command finds all of the significant combinations from the files with a significance level <= 0.05:
$ python lamp.py -p u_test sample/sample_item.csv sample/sample_expression_value.csv 0.05 > sample_u_test_result.txtWhen the LAMP finishes successfully, the result is printed in sample_u_test_result.txt:
# LAMP ver. 2.0.0
# item-file: sample/sample_item.csv
# value-file: sample/sample_expression_value.csv
# significance-level: 0.05
# P-value computing procedure: u_test (greater)
# # of tested elements: 4, # of samples: 15
# Adjusted significance level: 0.01, Correction factor: 5 (# of target rows >= 3)
# # of significant combinations: 1
Rank Raw p-value Adjusted p-value Combination Arity # of target rows z-score
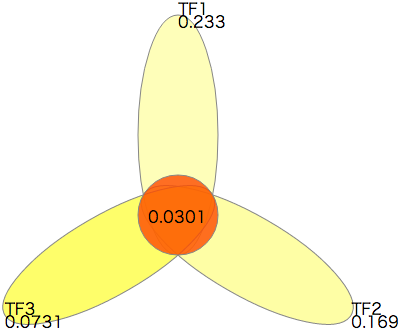
1 0.0060241 0.030121 TF1,TF2,TF3 3 5 2.5107
Time (sec.): Computing correction factor 0.038, Enumerating significant combinations 0.000, Total 0.038
The lines which starts from ”#” indicates the meta-data including the following information:
- The version of LAMP (line 1)
- The setting of the analysis. (lines 2 to 5)
- The number of columns and rows in the item-file (
sample_item.csv). (line 6) - The adjusted significance level and the correction factor. When the raw p-value <= 0.01 (calculated by 0.05/5), the combination is called significant. (line 7)
- The number of significant combinations. There is one significant combination. (line 8)
The other lines indicate the result such as the following:
- The ternary combination of TFs TF1, TF2 and TF3 is significant. The raw p-value is 0.00602, and the adjusted p-value is 0.0301.
- The running time is 0.023 sec. in total.
The right diagram shows the adjusted P-values related to the significant combination. This diagram can be drawn in the SVG format file sample_u_test_result.txt-flower1.svg by the following command.
$ python flower.py sample_u_test_result.txtDemonstration 2: Fisher’s Exact Test
By changing the file “sample/sample_expression_value.csv” and the option “-p u_test” with “sample/sample_expression_over1.csv” and “-p fisher” in Demonstration 1, you can perform LAMP with Fisher’s exact test. We here use the following two samples in sample/ directory.
-
- sample_item.csv
- The example file of item-file. This file is same as the file used in Demonstration 1.
-
- sample_expression_over1.csv
- A sample file of value-file to use Fisher’s exact test. Expression levels should be “0” or “1”.
The following command finds all significant combinations from the files with a significance level <= 0.05:
$ python lamp.py -p fisher sample/sample_item.csv sample/sample_expression_over1.csv 0.05 > sample_fisher_result.txtWhen the LAMP finishes successfully, the result is printed in sample_fisher_result.txt:
# LAMP ver. 2.0.0
# item-file: sample/sample_item.csv
# value-file: sample/sample_expression_over1.csv
# significance-level: 0.05
# P-value computing procedure: fisher (greater)
# # of tested elements: 4, # of samples: 15, # of positive samples: 7
# Adjusted significance level: 0.01, Correction factor: 5 (# of target rows >= 5)
# # of significant combinations: 1
Rank Raw p-value Adjusted p-value Combination Arity # of target rows # of positives in the targets
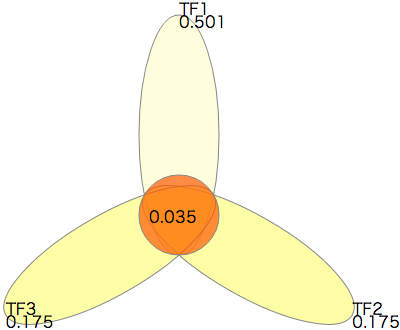
1 0.006993 0.034965 TF1,TF2,TF3 3 5 5
Time (sec.): Computing correction factor 0.011, Enumerating significant combinations 0.000, Total 0.011
The eight lines which start from ”#” are similar to the result file with Mann-Whitney U-test. The significant result indicates the following:
- When the raw p-value <= 0.01 (calculated by 0.05/5), the combination is called significant.
- There is one significant combination. The ternary combination of TFs TF1, TF2 and TF3 is significant. The raw p-value is 0.00699, and the adjusted p-value is 0.0350.
- The running time is 0.016 sec. in total.
The right diagram shows the adjusted P-values related to the significant combination. This diagram can be drawn in the sample_fisher_result.txt-flower1.svg by the following command.
$ python flower.py sample_fisher_result.txtDemonstration 3: Analysis example of Human breast cancer dataset
We here show the example of public microarray data analysis. Before performing LAMP, we need to convert the public breast cancer data into file format used in LAMP. The procedure is in Data preparation.
The preparation generates item file “gse6462_item.csv” and expression file “gse6462_expression_over1.csv”. The following command finds all of the significant combinations from the files with Fisher’s exact test of significance level <= 0.05:
$ python lamp.py -p fisher gse6462_item.csv gse6462_expression_over1.csv 0.05 > gse6462_expression_over1_result.txtWhen the LAMP finishes successfully, the result is printed in gse6462_expression_over1_result.txt:
# LAMP ver. 2.0.0
# item-file: gse6462_item.csv
# value-file: gse6462_expression_over1.csv
# significance-level: 0.05
# P-value computing procedure: fisher
# # of tested elements: 397, # of samples: 12773, # of positive samples: 1129
# Adjusted significance level: 1.3332e-08, Correction factor: 3750336 (# of target rows >= 8)
# # of significant combinations: 3
Rank	Raw p-value	Adjusted p-value	Combination	Arity	# of target rows	# of positives in the targets
1	3.7083e-10	0.0013908	TATA	1	957	141
2	2.9459e-09	0.011048	TATA,NFAT,PAX,AR	4	10	9
3	3.6422e-09	0.01366	GR,EVI1,CTTTAAR_UNKNOWN,LEF1,OCT1,NFAT,FOXO4,CEBP	8	8	8
Time (sec.): Computing correction factor 137.106, Enumerating significant combinations 60.477, Total 197.584
In some application, the combinations “TATA,NFAT,PAX,AR” may be regard as redundant combination because one of the members “TATA” has smaller P-value than the combination. In the case that you would like to reduce the combinations, we prepared a python script to eliminate the redundant combinations as the post-processing:
$ python eliminate_comb.py gse6462_expression_over1_result.txt > gse6462_expression_over1_result_eliminated.txt The result is printed in gse6462_expression_over1_result_eliminated.txt:
# Non-redundant combinations
# LAMP ver. 2.0.0
# item-file: gse6462_item.csv
# value-file: gse6462_expression_over1.csv
# significance-level: 0.05
# P-value computing procedure: fisher
# # of tested elements: 397, # of samples: 12773, # of positive samples: 1129
# Adjusted significance level: 1.3332e-08, Correction factor: 3750336 (# of target rows >= 8)
# # of significant combinations: 3 -> 2
Rank	Raw p-value	Adjusted p-value	Combination	Arity	# of target rows	# of positives in the targets
1	3.7083e-10	0.0013908	TATA	1	957	141
2	3.6422e-09	0.01366	GR,EVI1,CTTTAAR_UNKNOWN,LEF1,OCT1,NFAT,FOXO4,CEBP	8	8	8
Time (sec.): Computing correction factor 137.106, Enumerating significant combinations 60.477, Total 197.584
This script prints “# Non-redundant combinations” in the first line. The other lines are same as the gse6462_expression_over1_result.txt excepting the elimination of “TATA,NFAT,PAX,AR”.
Note that the running time of LAMP depends on the data (not only data size but also density of the data etc.). In the worst case, a few days and more than a hundred gigabytes of memory might be used. In general, the running time of Mann-Whitney U-test is longer than that of Fisher’s exact test.
Usage
LAMP
In the lamp directory, you can run LAMP using the following command:
$ python lamp.py -p [p-value-procedure] [item-file] [value-file] [significance-level] > [output-file]The result is saved to the ‘output-file’. LAMP requires one option and three arguments:
-
- -p {"fisher", "chi", "u_test"}
- This option selects the p-value calculation procedure. "fisher"; (Fisher's exact test), "chi" (Chi-squared test) or "u_test" (Mann-Whitney U-test) are available.
-
- item-file
- The file that includes associations between TFs and genes.
-
- value-file
- The gene expression file.
-
- significance-level
- The statistical significance threshold.
You can change the setting by using the following option:
-
- --alternative={"greater", "less", "two.sided"}
- Indicate which alternative hypothesis is used. Select "greater", "less" or "two.sided". The default setting is "greater".
-
- --max_comb=[integer]
- Set the maximum arity of the tested combinations. The default setting is no limit.
-
- -e [log_file]
- Change the filename to save the running progress. The default setting is lamp_log_[date]_[time].txt.
-
- --lcm=[lcm_path]
- Set LCM program path if you do not use ./lcm53/lcm.
FastWY
In the lamp directory, you can run fastWY using the following command:
$ python fastwy.py -p [p-value-procedure] [item-file] [value-file] [significance-level] [k] > [output-file]The result is saved to the ‘output-file’. In addition to the option and arguments for LAMP, fastWY requires an argument:
-
- k
- the number of permutation test to estimate null distribution.
You can use the identical options to LAMP so as to change setting.
Post-processing
LAMP generates all significant combinations. However, in some applications, the raw result may be too redundant to be used because two very similar but slightly different combinations are appeared in the results. To support the interpretation of the result, we prepared the script eliminate_comb.py. This script selects the combination which is the most significant in all subsets of the combination. That is, suppose that the combinations A and B are significant, and A has smaller P-value than that of B. When A comprises B or A is comprised by B, the significance of B would be due to A. By using eliminate_comb.py, we remove the combinations such as B from the results of LAMP. When the P-values are equal between A and B, the smaller combination is eliminated.
In the LAMP directory, you can run this script using the following command:
$ python eliminate_comb.py [lamp-output-file] > [eliminated-output-file]eliminate_comb.py requires two filenames.
-
- lamp-output-file
- The result file of LAMP.
-
- eliminated-output-file
- The filename to output the result of this script.
Flower Diagram
LAMP includes the code for visualizing the detected combinations as shown in Examples. In the lamp directory, you can run the code using the following command:
$ python flower.py [lamp-output-file][lamp-output-file] is the result file of LAMP.
The diagrams are saved to SVG format files named [lamp-output-file]-flower[rank].svg. [rank] corresponds to the “Rank” column in [lamp-output-file].
Input File Format
LAMP receives two input files: item-file and value-file. Their examples are in the sample/ directory.
Item-file
The item-file provides the associations between TFs and their target genes. This file should be formatted according in the CSV format. sample/sample_item.csv is an example.
#gene,TF1,TF2,TF3,TF4
A,1,1,1,0
B,1,1,1,0
C,1,0,0,1
D,0,0,0,0
...
The first line provides the names of TFs.
The following lines include the associations between a gene and TFs. The first column indicates the gene name. The other columns indicate whether the TF targets the gene. If the gene is targeted by the TF, the column value is ‘1’. If not, the value is ‘0’. For instance, gene A is target gene of TF1, TF2 and TF3 in the example.
sample/sampe_item.csv contains 15 genes and 4 TFs. Thus, the file consists of 16 lines and 5 columns.
Value-file
The value-file provides the gene expressions levels. The file is the CSV format with two columns: the gene name and the expression level.
When LAMP derives the p-value using the Mann-Whitney U-test, the expressions levels are any real values. However, when LAMP calculates the p-value using Fisher’s exact test, the expression levels are 1 or 0. If the gene is up-regulated, then the second column is 1. Otherwise, it is 0.
The comment lines start with ’#’ and are ignored by the analysis.
As examples, we show the content of the sample files.
samples/sample_expression_value.csv
This file is prepared for the Mann-Whitney U-test. The second column takes real values.
#gene,expression
A,1.5
B,1.2
C,0.9
D,0.8
...
samples/sample_expression_over1.csv
This file is prepared for Fisher’s exact test. The values in the second column are 1 or 0.
#gene,expression
A,1
B,1
C,0
D,0
...
This file was generated from samples/sample_expression_value.csv. If the gene expression is higher than 1.0 then expression level is 1. Otherwise, it is 0.
Both sample/sampe_expression_value.csv and sample/sampe_expression_over1.csv describe the expressions of 15 genes.
Note for Input Files
The gene orders in the item-file and the value-file should be identical. For example, both sample/sample_item.csv and sample/sample_expression_value.csv consist of 15 genes from gene A to O. If the given gene sets are different or are in a different order, LAMP does not run properly.
Output Format
The result is printed out after the analysis settings and the adjusted significance level. The first nine lines are formatted as the following:
# LAMP [version]
# item-file: [item-file]
# value-file: [value-file]
# significance-level: [float]
# P-value computing procedure: [p-value-procedure]
# # of tested elements: [integer], # of samples: [integer]
# Adjusted significance level: [float], Correction factor: [integer] (# of target rows >= [integer])
# # of significant combinations: [integer]
The first line shows the version of LAMP. The inputted files and analyses setting are written from the second to fifth lines. The other lines indicate as the following:
-
- # of tested elements and # of samples
- The number of columns and rows in item-file.
-
- Adjusted significance level
- The threshold for non-adjusted p-value. The combination is significant when the raw p-value is less than this value.
-
- Correction factor
- The number of testable combinations. The adjusted p-value is computed by multiplying the raw p-value by this value.
-
- # of target rows
- The minimum number of target genes targeted by a testable TF combination.
-
- # of significant combinations
- The number of significant combinations.
The detected combinations are shown after the ninth line. Each line contains 5 columns:
-
- Rank
- The rank ordered by the p-value.
-
- Raw p-value
- The p-value calculated using p-value-procedure.
-
- Adjusted p-value
- The adjusted p-value. The value of each combination printed by LAMP is smaller than the significance level. If the value is smaller than the inputted significance level, the combination is significant.
-
- Combination
- The significant combination. The TFs are delimited by ’,’ (comma).
-
- Arity
- The number of elements in the combination.
-
- # of target rows
- The number of target genes of the combination.
-
- # of positives in the targets / z-score
- The value used to compute the p-value. In case of calculation by Fisher’s exact test, the value means the number of genes that are both targeted and up-regulated. In the case of calculation by Mann-Whitney U-test, the value is the z-score.
The last line includes the calculation time (in seconds):
Time (sec.): Correction factor [float], P-value [float], Total [float]-
- Correction factor
- The time to compute the correction term.
-
- P-value
- The time required to calculate the p-values of the testable combinations.
-
- Total
- Total time.
Note
LAMP produces an LCM argument file and the LCM result files. One is saved as item-file.4lcm53, and the others are saved in item-file.4lcm53.results/ directory.
If you want to remove these files, please use the following command:
$ rm -rf item-file.4lcm53.*License
LAMP is open source code issued under the BSD License.
Contributors
Aika Terada wrote the LAMP code, excluding LCM for enumerating frequent patterns. Takeaki Uno implemented LCM to add the LAMP option for fast computation of the optimal minimum support. The original LCM can be downloaded from Program Codes of Takeaki Uno and Hiroki Arimura. The LAMP is developed through discussions with Jun Sese, Koji Tsuda, and Shin-ichi Minato.
We would like to thank Takayuki Itoh for developing the code to draw the flower diagram.
Contact
Please contact the below address in case you find a bug, need detailed information or need application for different situation and so on.
- lamp_staff(AT)googlegroups.com
Reference
- Shin-ichi Minato, Takeaki Uno, Koji Tsuda, Aika Terada, and Jun Sese. A Fast Method of Statistical Assessment for Combinatorial Hypotheses Based on Frequent Itemset Enumeration. In Proceedings of the European Conference on Machine Learning and Principles and Practice of Knowledge Discovery in Databases 2014 (ECML PKDD 2014). Nancy, France. September 15-19, 2014.
- Aika Terada, Koji Tsuda, and Jun Sese. Fast Westfall-Young permutation procedure for combinatorial regulation discovery. In Proceedings of 2013 IEEE International Conference on Bioinformatics and Biomedicine (BIBM 2013). 153-158. Shanghai, China. December 18-21, 2013.
- Aika Terada, Mariko Okada-Hatakeyama, Koji Tsuda and Jun Sese. Statistical significance of combinatorial regulations. Proc. Natl. Acad. Sci., vol. 110, no. 32, 12996-13001, August 6, 2013.