Data preparation
Here, we prepare codes for the analysis of real data. The LAMP takes a few hours to analyze the generated data.
These codes were written under the following assumptions:
- Molecular Signatures Database (MSigDB) is used to generate the associations between the genes and the TFs.
- The expression profile is observed by using microarray of Affymetrix.
For an example, GSE6462 dataset, which is stored in Gene Expression Omnibus (GEO), is used as the expression profile data. This example requires three files:
-
- c3.tft.v3.0.entrez.gmt [Download (registration required)].
- Associations between TF binding sites and genes which are collected in MSigDB. The motif gene set (c3) is used to give the associations between TFs and genes.
-
- GSE6462_series_matrix.txt [Download zip file]
- The gene expression profiling of human breast cancer cells.
-
- HG-U133_Plus_2.na32.annot.csv [Download zip file (registration required)]
- The annotation file for Affymetrix Human Genome U133A 2.0 Array. The file is released by Affymetrix.
First, please download these files and decompress them in lamp directory. Then, try the following 6 commands:
$ python convert_id.py HG-U133_Plus_2.na32.annot.csv GSE6462_series_matrix.txt to_exp.csv
$ python exp2ratio.py -t 12 to_exp.csv gse6462_expression.csv
$ python ratio2flag.py gse6462_expression.csv 1.0 gse6462_expression_over1.csv
$ python gsea4csv.py c3.tft.v3.0.entrez.gmt to_item.csv
$ python merge_exp_csv.py gse6462_expression.csv to_item.csv gse6462_item.csv
$ python check_files.py gse6462_item.csv gse6462_expression.csvgse6462_expression.csv, gse6462_expression_over1.csv and gse6462_item.csv are generated by the above commands. The commands generate two other intermediate files: to_exp.csv and to_item.csv. The next figure illustrates the flow of the conversion files.
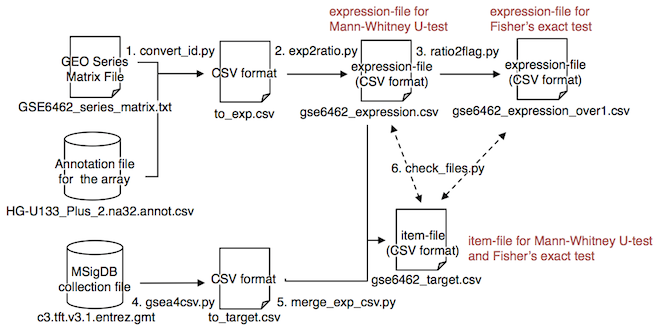
The flow is derived from the 6 codes:
-
- convert_id.py
- Conversion of the prob ID to GenBank ID in Affymetrix microarray data.
- Argument 1: The annotation file that is downloaded from Affymetrix.
- Argument 2: GEO Series matrix file.
- Argument 3: The output file (intermediate-file1)
-
- exp2ratio.py
- This code is written for the
GSE6462_series_matrix.txt, which calculates target condition’s log2 ratio of the expression levels to the control conditions for each gene. - Option -t: The target condition column number. The number starts 3 (column 0 is for the gene name, and columns 1 and 2 are control conditions).
- Argument 1: The intermediate-file1.
- Argument 2: Output file (expression-file when the Mann-Whitney U-test is selected to compute the p-value)
-
- ratio2flag.py
- Classification of the gene expression level to 1 (up-regulated) or 0 (unregulated). This code is available to generate the expression-file for the computation of p-value using Fisher’s exact test.
- Argument 1: The expression-file for the Mann-Whitney U-test.
- Argument 2: Threshold for division genes to 1 or 0.
- Argument 3: Output file (expression-file when Fisher’s exact test is selected to compute the p-value)
-
- gsea4csv.py
- Changing the downloaded file from MSigDB to CSV format.
- Argument 1: MSigDB collection file.
- Argument 2: the output file (intermediate-file2).
-
- merge_exp_csv.py
- Addition/deletion of genes in the CSV formatting file to become the same gene set in expression-file. This code is available for any situation.
- Argument 1: The expression-file.
- Argument 2: CSV format file that contains the associations between the gene and TF.
- Argument 3: The output file (item-file to LAMP)
-
- check_files.py
- Checking the gene set in both the item-file and the expression-file. When the two files contain different genes, these genes is printed. This code is available for any situation.
- Argument 1: The item-file for LAMP.
- Argument 2: The expression-file for LAMP.
These codes are available for the other situations because the codes are run individually.